Collaborators :
Gabriella Muinde
Abstract:
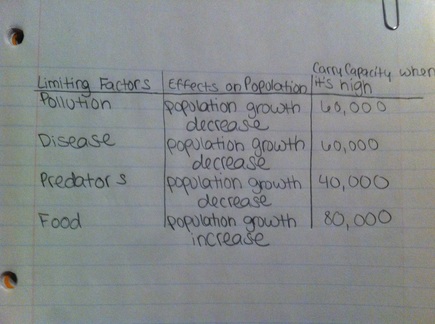
Limiting Factors are factors that control the growth of the population of certain things. A great example would be plants that receive a lot of attention from the sunlight, good soil and many other things. But if they are constantly being grazed on by goats then their population would be very limited. So for the plants their limiting fact would be goats. For this lab we had to work with the website to try and figure out the limiting factors on a simulated factor of tuna. Through each stage you would work with the different steps to try and figure out what things had greater impacts on the population of tuna in the water. You were also trying to keep the fish at the sustainable amount of 60,000 fishes.
Problem:
What are the effects of limiting factors on the population of tuna?
Materials:
Simulation found at http://sepuplhs.org/high/sgi/teachers/fishery_sim.html
Procedure:
1. Work with your partner to follow the tutorial in the simulation to familiarize yourself with how the simulation works. Read each screen carefully and be sure you understand each part of the tutorial before moving to Stage 1 of the simulation.
2. In Stage 1, click on the “Show Normal Population Growth” box to see the graph of what happens to this population if reproduction, migration, and death rates are moderate.
3. Explore what happens to the population as you change the three variables. In your science notebook, record your observations of what happens to the sustainability of the population. What variable settings cause the population growth rate to increase? What settings cause it to decrease? What settings cause the population growth rate to stay steady? What are the limiting factors?
4. Scientific advisors to the fishery have determined that the population is sustainable at 60,000 fish. Use the simulation to determine what settings for the three variables maintain the population at 60,000 fish. Record the graph and the settings in your science notebook.
5. Scientific advisors have reexamined the population data for the Avril Gulf tuna and determined that the population is sustainable at 80,000 fish. With your partner, predict what settings would maintain the population at 80,000 fish. Write down your predictions in your science notebook, and then use the simulation to test your prediction. If necessary, change the settings as you run the simulation. Record the graph and the settings in your science notebook.
6. Move to Stage 2, and repeat Steps 3 through 5. Note that in Stage 2 you cannot control pollution or disease events, which will occur at random intervals.
7. Move to Stage 3, and repeat Steps 3 through 5.
8. Move to Stage 4. In this stage, all of the factors are combined. Predict what settings will allow for a maximum amount of fishing while maintaining the fish population (i.e., have a sustainable fishery). Repeat Steps 3 through 5, but incorporate the maximum amount of fishing possible.
9. With your partner discuss the following questions. Record your conclusions in your science notebook
Data:
Gabriella Muinde
Abstract:
Limiting Factors are factors that control the growth of the population of certain things. A great example would be plants that receive a lot of attention from the sunlight, good soil and many other things. But if they are constantly being grazed on by goats then their population would be very limited. So for the plants their limiting fact would be goats. For this lab we had to work with the website to try and figure out the limiting factors on a simulated factor of tuna. Through each stage you would work with the different steps to try and figure out what things had greater impacts on the population of tuna in the water. You were also trying to keep the fish at the sustainable amount of 60,000 fishes.
Problem:
What are the effects of limiting factors on the population of tuna?
Materials:
Simulation found at http://sepuplhs.org/high/sgi/teachers/fishery_sim.html
Procedure:
1. Work with your partner to follow the tutorial in the simulation to familiarize yourself with how the simulation works. Read each screen carefully and be sure you understand each part of the tutorial before moving to Stage 1 of the simulation.
2. In Stage 1, click on the “Show Normal Population Growth” box to see the graph of what happens to this population if reproduction, migration, and death rates are moderate.
3. Explore what happens to the population as you change the three variables. In your science notebook, record your observations of what happens to the sustainability of the population. What variable settings cause the population growth rate to increase? What settings cause it to decrease? What settings cause the population growth rate to stay steady? What are the limiting factors?
4. Scientific advisors to the fishery have determined that the population is sustainable at 60,000 fish. Use the simulation to determine what settings for the three variables maintain the population at 60,000 fish. Record the graph and the settings in your science notebook.
5. Scientific advisors have reexamined the population data for the Avril Gulf tuna and determined that the population is sustainable at 80,000 fish. With your partner, predict what settings would maintain the population at 80,000 fish. Write down your predictions in your science notebook, and then use the simulation to test your prediction. If necessary, change the settings as you run the simulation. Record the graph and the settings in your science notebook.
6. Move to Stage 2, and repeat Steps 3 through 5. Note that in Stage 2 you cannot control pollution or disease events, which will occur at random intervals.
7. Move to Stage 3, and repeat Steps 3 through 5.
8. Move to Stage 4. In this stage, all of the factors are combined. Predict what settings will allow for a maximum amount of fishing while maintaining the fish population (i.e., have a sustainable fishery). Repeat Steps 3 through 5, but incorporate the maximum amount of fishing possible.
9. With your partner discuss the following questions. Record your conclusions in your science notebook
Data:
Analyst and Conclusion ( Lab Questions):
In Stage 1:
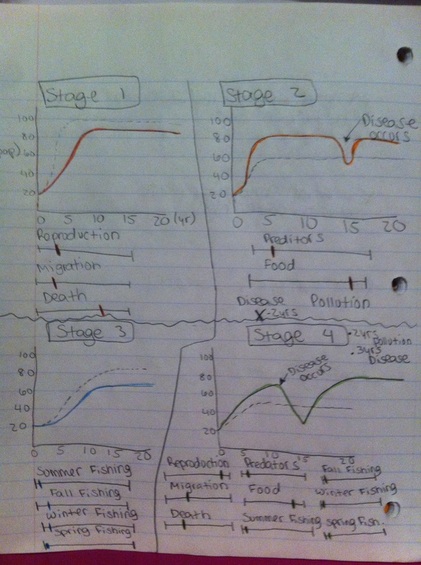
1. In this stage I tested the process multiple times. The reproduction rate, migration rate and death rate are all limiting factors for tuna. This is true because each of these factors have major impacts on the population of the tuna. When the rate of reproduction and migration are high the population of the fish will increase. Then when the rate of death is high there will be a decrease in the population of the tuna because a lot of fish will be dying. When the factors are all around the same amount there will be a balanced population because there will be fish dying and fish being born.
2. In stage one I had a carrying capacity that was a little higher then 80,ooo fish . This was with a little bit of migration and reproduction with a high amount of death rate in the fishes. As the years began to increase the rate became balanced at that amount of fishes.
In Stage 2:
3. Every time that I tested the graphs there was a high amount of decrease in the population of fishes when pollution occurred for two years. When playing around with the limiting factors there was a time when the pollution occurred for three years and caused the population of tuna to go from over 80,000 fishes to less then 20,000 fishes.
4. Once the pollution had occurred and the graph continued to move it then took the fishes about 5 years to return back to their above 80,000 amount that it had originally had.
5. When the disease occurred in the stage two graph above it also had a decrease in the population growth. The fishes went from about 80,000 fishes to about less thank 60,00. Although it did not decrease as much as the pollution there was still a decrease in the population.
6. After the disease had occurred for its two years the population returned back to its original amount fairly quick. Based on the graph shown above it only took about 2-3 years which was less then the amount of time that it took for pollution.
In Stage 3:
7. As I was playing around with the amount of fishing regulations there were multiple changes. The more that humans interact with the environment the less tuna there will be. So in order for me to keep the carrying capacity at around 60,000 the humans interacting with the environment had to be really low. So I allowed for there to be barely any fishing in the spring with little bit of fishing in the summer, fall and winter. This allowed for the fish population to be at the steady amount that it needed to be.
In Stage 4:
8. After testing the process multiple times I came to a solution. The highest amount the the summer, spring, winter and fall fishing can be is a little under half there is not a heavy amount of fishing but then again it is not very light either. This is possible when the migration rate and reproduction rate is as high as it can go. Then the death and predators rate are both really low. Then lastly there was a high amount of food in the water and disease only occurred for tow years but the fish rapidly returned to their 60,000 sustainability amount.
9. In this lab the limiting factors would be density-dependent. This is true because depending on how high the population is this will determine how much these limiting factors effect it. Then the density-independent factor would be the population.
10. This simulation is a great resource for biologist. This is true because it shows that the more fishing that is done the higher the amount of decrease in the fishes. When there is a controlled amount of fishing the fishes population remains at a balanced amount. Once the biologist see this they are able to make laws that allow for people to only be able to take a certain amount of fish at a time so that too many fish are not taken out of the water. These laws are meant to protect the fishes so that the population will not continue to decrease with no way of returning back to a balanced amount.
General Analyst and Conclusions:
Based on all the data that was receive in this lab I would say that the limiting factors have a very big impact on the population of the fishes. Depending on how high or how low some of these factors were that would determine the population of the fishes in the water. For example when there was a high amount of death rates, fishing, disease and pollution then the population of the fishes would decrease. But when there was a high amount of reproduction and migration rates then the population of the fishes would increase to their sustainable amount of over 60,000 fishes. The article that I chose shows that there needs to be a set amount for some of the limiting factors for fish. The biggest problem so far has been fishing. This factor has had a very big impact on the amount of fishes in the ecosystem. People who go fishing do not have a set amount of fishes that they can take. So when they go they fish out as many fishes as they want for how ever many times they want to. If all of the people continue to do this then the population of fishes would decrease drastically. That is exactly happened in the article I provided which is why they decided that they needed to meet and vote on this situation. Once voted on the people came to the decision that the amount of fishing needed to be reduced because the population of fishes was decreasing. This article and the website used are two things that show that the limiting factors have very big impacts on the population to not only fishes but to many other things.
Citations:
-Click on the Button Text for article
In Stage 1:
1. In this stage I tested the process multiple times. The reproduction rate, migration rate and death rate are all limiting factors for tuna. This is true because each of these factors have major impacts on the population of the tuna. When the rate of reproduction and migration are high the population of the fish will increase. Then when the rate of death is high there will be a decrease in the population of the tuna because a lot of fish will be dying. When the factors are all around the same amount there will be a balanced population because there will be fish dying and fish being born.
2. In stage one I had a carrying capacity that was a little higher then 80,ooo fish . This was with a little bit of migration and reproduction with a high amount of death rate in the fishes. As the years began to increase the rate became balanced at that amount of fishes.
In Stage 2:
3. Every time that I tested the graphs there was a high amount of decrease in the population of fishes when pollution occurred for two years. When playing around with the limiting factors there was a time when the pollution occurred for three years and caused the population of tuna to go from over 80,000 fishes to less then 20,000 fishes.
4. Once the pollution had occurred and the graph continued to move it then took the fishes about 5 years to return back to their above 80,000 amount that it had originally had.
5. When the disease occurred in the stage two graph above it also had a decrease in the population growth. The fishes went from about 80,000 fishes to about less thank 60,00. Although it did not decrease as much as the pollution there was still a decrease in the population.
6. After the disease had occurred for its two years the population returned back to its original amount fairly quick. Based on the graph shown above it only took about 2-3 years which was less then the amount of time that it took for pollution.
In Stage 3:
7. As I was playing around with the amount of fishing regulations there were multiple changes. The more that humans interact with the environment the less tuna there will be. So in order for me to keep the carrying capacity at around 60,000 the humans interacting with the environment had to be really low. So I allowed for there to be barely any fishing in the spring with little bit of fishing in the summer, fall and winter. This allowed for the fish population to be at the steady amount that it needed to be.
In Stage 4:
8. After testing the process multiple times I came to a solution. The highest amount the the summer, spring, winter and fall fishing can be is a little under half there is not a heavy amount of fishing but then again it is not very light either. This is possible when the migration rate and reproduction rate is as high as it can go. Then the death and predators rate are both really low. Then lastly there was a high amount of food in the water and disease only occurred for tow years but the fish rapidly returned to their 60,000 sustainability amount.
9. In this lab the limiting factors would be density-dependent. This is true because depending on how high the population is this will determine how much these limiting factors effect it. Then the density-independent factor would be the population.
10. This simulation is a great resource for biologist. This is true because it shows that the more fishing that is done the higher the amount of decrease in the fishes. When there is a controlled amount of fishing the fishes population remains at a balanced amount. Once the biologist see this they are able to make laws that allow for people to only be able to take a certain amount of fish at a time so that too many fish are not taken out of the water. These laws are meant to protect the fishes so that the population will not continue to decrease with no way of returning back to a balanced amount.
General Analyst and Conclusions:
Based on all the data that was receive in this lab I would say that the limiting factors have a very big impact on the population of the fishes. Depending on how high or how low some of these factors were that would determine the population of the fishes in the water. For example when there was a high amount of death rates, fishing, disease and pollution then the population of the fishes would decrease. But when there was a high amount of reproduction and migration rates then the population of the fishes would increase to their sustainable amount of over 60,000 fishes. The article that I chose shows that there needs to be a set amount for some of the limiting factors for fish. The biggest problem so far has been fishing. This factor has had a very big impact on the amount of fishes in the ecosystem. People who go fishing do not have a set amount of fishes that they can take. So when they go they fish out as many fishes as they want for how ever many times they want to. If all of the people continue to do this then the population of fishes would decrease drastically. That is exactly happened in the article I provided which is why they decided that they needed to meet and vote on this situation. Once voted on the people came to the decision that the amount of fishing needed to be reduced because the population of fishes was decreasing. This article and the website used are two things that show that the limiting factors have very big impacts on the population to not only fishes but to many other things.
Citations:
-Click on the Button Text for article
